Can We Trust Inertial and Heart Rate Sensor Data from an APPLE Watch Device? †


1
Griffith School of Engineering and Built Environment, Griffith University, Nathan Campus QLD 4111, Australia
2
School of Electrical and Electronic Engineering, The University of Adelaide, South Australia 5005, Australia
*
Author to whom correspondence should be addressed.
†
Presented at the 13th conference of the International Sports Engineering Association, Online, 22–26 June 2020.
Proceedings 2020, 49(1), 128; https://doi.org/10.3390/proceedings2020049128
Published: 15 June 2020
(This article belongs to the Proceedings of The 13th Conference of the International Sports Engineering Association)
Abstract
:The use of wearable technologies for the monitoring of human movement has increased considerably in the past few years, with applications to sports and other physical activities. Energy expenditure, walking and running distance, step count, and heart rate are some of the metrics provided by such devices via smart phone applications. Most of the research studies have involved validating the accuracy and reliability of the activity monitors by using the post-processed data from the device. The aim of this preliminary study was to determine if we can trust sensor data obtained from an Apple watch. This study evaluated the pre-processed data from the watch through step counting and heart rate measurements, and compared it with known validated devices (in-house 9DOF inertial sensor and Polar H10TM). Repeated activities (walking, jogging, and stair climbing) of varying duration and intensity were conducted by participants of varying age and body mass index (BMI). Pearson correlation (r > 0.95) and Bland–Altman statistical analyses were applied to the data to determine the level of agreement between the validated devices and the watch. The sensors from the Apple watch counted steps and measured heart rate with a minimum error and performed as expected.
1. Introduction
The use of wearable fitness devices for sports, healthcare and wellbeing applications has grown considerably over the past decade. The increase in the demand of these devices from the standard consumer has led to a highly competitive market. Energy expenditure, walking and running distance, step count, sleep/wake times, stand hours, flights climbed, and heart rate are some of the metrics provided by such devices via smart phone applications, which help promote physical activity within the general public. The benefits of participating in physical activities (PA) are well documented [1], although increasing the level of PA within the general population has proven to be difficult [2].
In addition to everyday use within the general population, the use of wearables is also transitioning into elite sport training. Researchers use inertial measurement units (IMU’s) for the measurement of athlete’s performance, fatigue, injury prevention, rehabilitation, and workload [3]. It may seem that the more metrics offered by the wearable device, the more attractive the device is to the consumer, at both general population and at athlete levels. This has increased the manufacture of smartwatches and fitness trackers over the past years. Most of these devices have been scrutinized due to their validity and accuracy, resulting in some disappearing from the market. The Apple watch in Q2 2019 had the largest sales in the North American Market with 37.9%, followed by Fitbit (24.2%), and Samsung (10.6%) [4]. The Apple watch series 4 contains an accelerometer with a range of 32 g, making the device attractive to not only the standard consumer, but also to sports athletes/coaches as impact sports (such as boxing, cricket, and tennis, etc.) require wider ranges that most commercial wearables currently do not offer.
The evaluation of accuracy, precision, reliability and overall performance of wearables, including the Apple watch, has been the focus of extensive research [5,6,7,8,9,10]. This includes comparisons of heart rate-based devices with electrocardiogram and with ‘golden standard’ devices [5,6,7]. Comparisons have also been conducted between wearables, for the assessment of metrics including physical activity, walking speed, step count and energy expenditure [8,9,10].
Most of the literature, however, focuses on validating the accuracy and reliability of the device by using post-processed data (i.e., Health App for Apple devices). Every device contains proprietary algorithms for data analysis and classification that are not easily accessible to the user; therefore, the reliability of the device depends on the processing of the data, rather than on the sensor itself. This preliminary study evaluated the pre-processed (raw) data from an Apple watch for the validation of its inertial and heart rate sensors. Results were compared with an in-house 9DOF (Nine Degrees of Freedom) IMU and Polar H10™. Repeated activities (walking, running and stair climbing) of varying duration were conducted by participants of varying age and body mass index (BMI). The Apple watch was also validated against counted observations.
2. Methods
2.1. Instrumentation and Device Data Acquisition
The performance of an Apple watch (worn on the wrist) was tested against two different wearable technologies. Such technologies included a fully validated in-house generic monitoring platform design (Sabel Sense IMU, Griffith University, Nathan, Australia [11,12]), and a chest-based heart rate monitor (Polar H10; www.polar.com/au-en). The Apple watch contains 3-axis accelerometers, 3-axis gyroscopes, and 3-axis magnetometers. In addition, it contains a heart rate monitor based on Photoplethysmography technology [7].
The IMU has dimensions 55 × 30 × 13 mm (length × width × height) and a weight of 23 gm. It contains wireless connectivity (2.4 GHz). The sensor includes a ±16 g 3-axis accelerometer, a ±2000 °/s 3-axis gyroscope and a ±7 Gauss 3-axis magnetometer. The maximum sampling rate is 500 Hz. Polar H10 is the latest model of Polar Electro Oy. This device has been recognized as the world’s most accurate wearable monitor and the ‘golden standard’ device for scientific studies [6], with a 99% accuracy when compared with a wired electrocardiogram (ECG). The device is based on a chest strap electrode that records the electrical activity of the heart. The ECG raw data is processed by proprietary algorithms and transmitted using Bluetooth® to a smart phone application as heart rate values per second (sampling rate is 1 Hz). The monitor is controlled by the mobile app ‘Polar Beat’. The processed data can be exported and visualized by the on-line analyzer tool ‘Polar Flow’.
Both the Apple watch and the IMU were set to 50 Hz as it was sufficient to capture the step movements. Inertial sensor data from the Apple watch was also validated against counted observations. The Apple watch data acquisition was performed using a third-party software named ‘SensorLog’ (sensorlog.berndthomas.net). SensorLog recorded the raw sensor data and generated csv (comma-separated values) files. The recorded data from the Apple watch was transmitted using Bluetooth® to a smart phone, which allowed extraction of the csv files.
To continuously record heart rate data measured by the Apple watch, the watch was placed in ’workout mode–outdoor walk’. In this mode, the watch recorded approximately 10 to 15 samples per minute and the data was automatically synchronized with the Health App from Apple on the smart phone. Third-party software named ‘QS Access’ was used to export the heart rate data from the Health App into a csv file for later analysis. The Polar H10 supplied the heart rate information at one value per second.
2.2. Participants and Protocol
The sample consisted of participants with a medium level of fitness (age: 55 ± 13 years; weight: 81.6 ± 10.6 kg; height: 1.76 ± 0.10 m; and BMI: 26.1 ± 0.96 kg/m2). Skin tone for the participants was rated as Types III and IV using the Fitzpatrick skin tone scale (Types I–VI) [13]. Participants were informed of the reasons for the study and signed a consent form to participate in the study (ethics approval number: GU 2017/587).
The field tests were conducted at a 400 m synthetic tartan surfaced running track with uniform consistency under clear weather conditions.
For the analysis of step counting, participants placed both the Apple watch and the IMU on their left arm. The IMU was secured in place with a fabric armband fitted with Velcro™ around the wrist. Participants were asked to stand motionless for 10 s at the beginning of the track, then walk for a total of 700 m and then stop motionless for 10 s. After a 3 min break, participants were asked to stand motionless for 10 s, then jog for a total of 300 m and then stop motionless for 10 s.
For the analysis of heart rate, the Apple watch was fitted tightly on the participant’s wrist. In addition, participants placed the Polar H10 on the chest as per the recommended fitting by Polar. Participants were asked to repeat the same protocol for step counting plus an extra test (stair climbing) to intensify the physical activity and increase the variability in the heart rate measurements. A grandstand (length 100 m with a 30-step staircase) was used for the test. Participants were asked to climb up, walk to the next staircase, and climb down. This process was repeated three times for each participant.
2.3. Statistical Analysis
Three different metrics were used for the inertial sensor and heart rate validation. All data processing and statistical analysis were conducted using Matlab® and Microsoft Excel®:
- 1)
- Mean values for step counting and heart rate monitoring using bar charts.
- 2)
- Correlation analysis of raw data using Pearson’s correlation coefficient to examine the strength of the relationship between the Apple watch and the benchmark devices.
- 3)
- Bland–Altman analysis [14] was used to assess more accurately the level of agreement between the Apple watch and the benchmark devices. The difference between two sets of data and the average between them was determined. In addition, the mean bias (mean of the difference), and upper and lower Limits of Agreement (LoA) were included in the results.
3. Results
3.1. Step Counting Measurements
For step detection, the raw accelerometer data collected from the Apple watch and from the IMU was filtered using a 6th order low-pass digital Butterworth filter with normalized cut-off frequency, and zero-phase digital filtering to remove the unwanted peaks and smooth the signal. A peak finder algorithm was used to automatically detect the peaks above a minimum peak height. Each peak identified by the algorithm indicated a walking or jogging step.
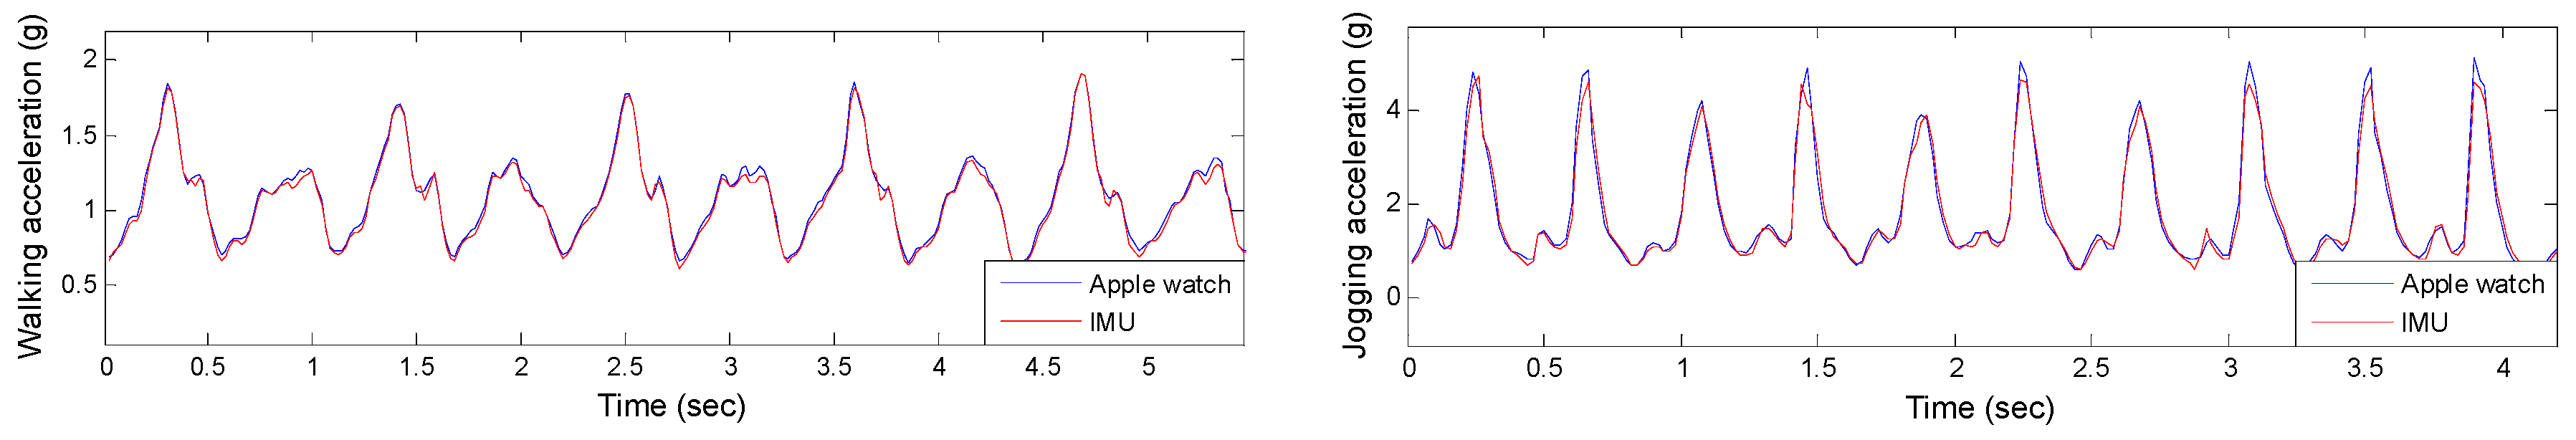
Figure 1 shows an example of 10 steps recorded by the Apple watch and IMU’s raw unfiltered acceleration data, for both walking and jogging, as a function of time. The walking profile shows a maximum acceleration of approximately 2 g, and the jogging shows a maximum acceleration of approximately 5 g, as would be expected as the intensity of the activity increases.
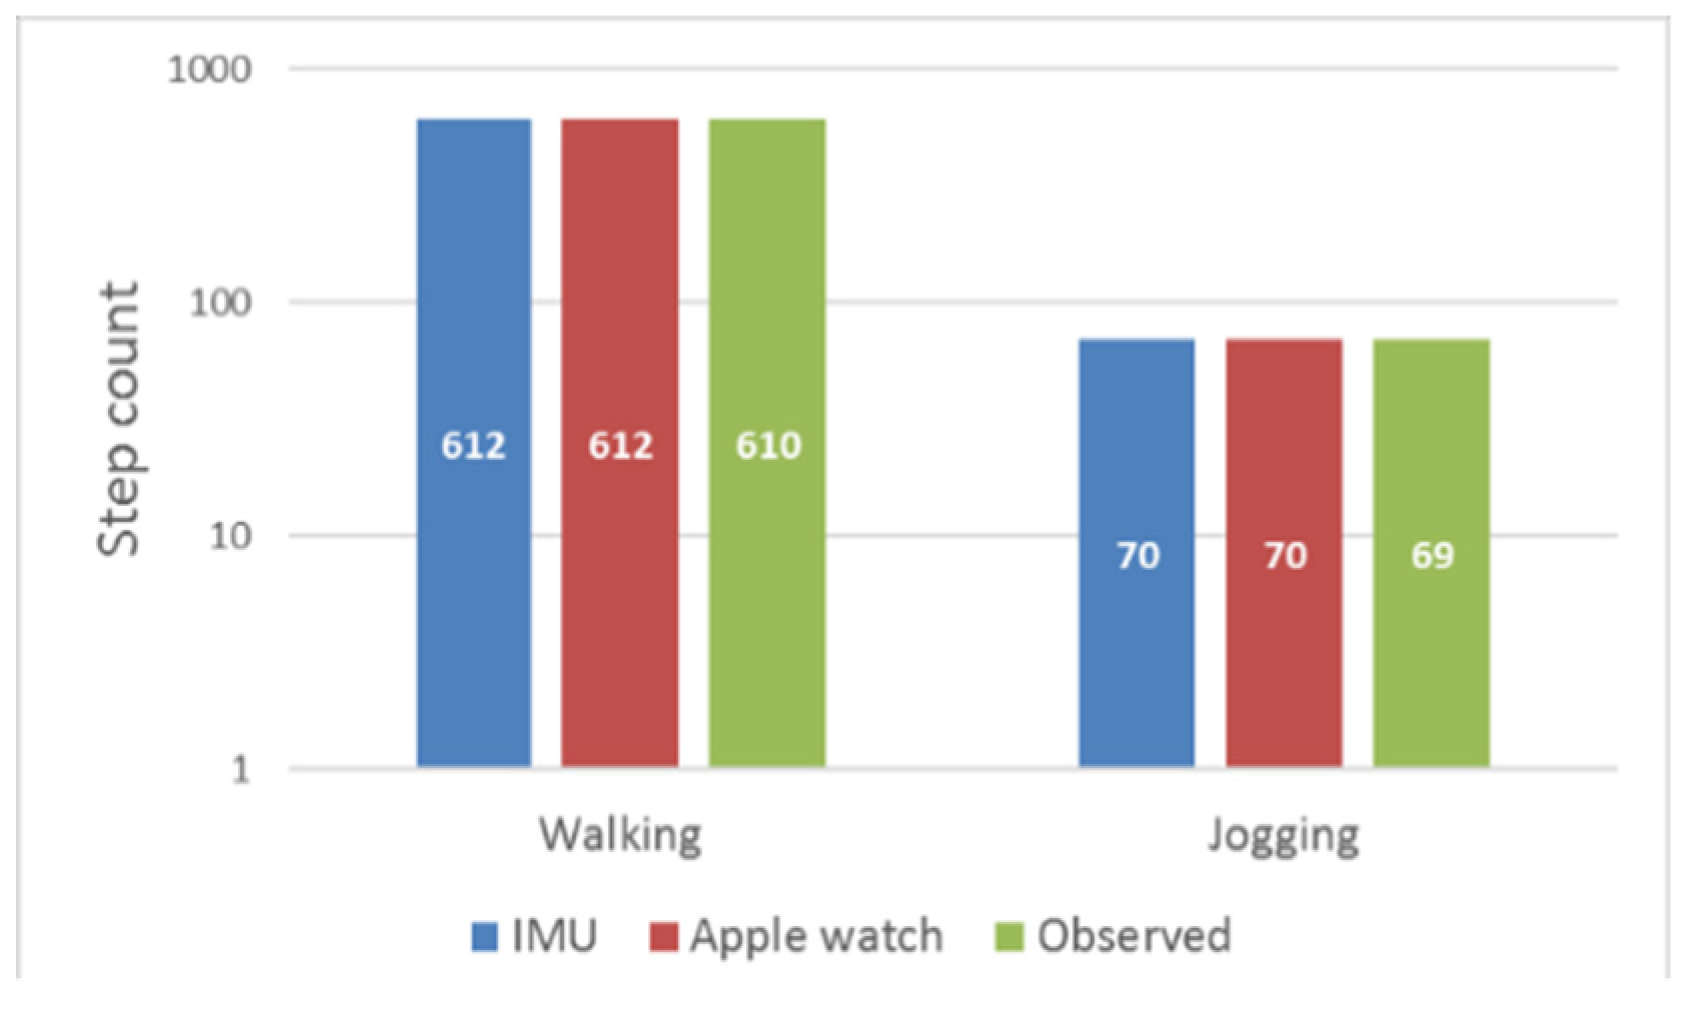
Figure 2 shows the mean steps for the 700 m walk and the 300 m jog of all participants added together. Both the Apple watch and the IMU showed high accuracy and consistency among participants. The small variations on the observed data could correspond to a missed or exceeded step located on the tail of the data that was not detected by the sensors; this is due to the sensors being placed on the wrist that may not be fully coupled with the leg movement when starting or finishing a walk.
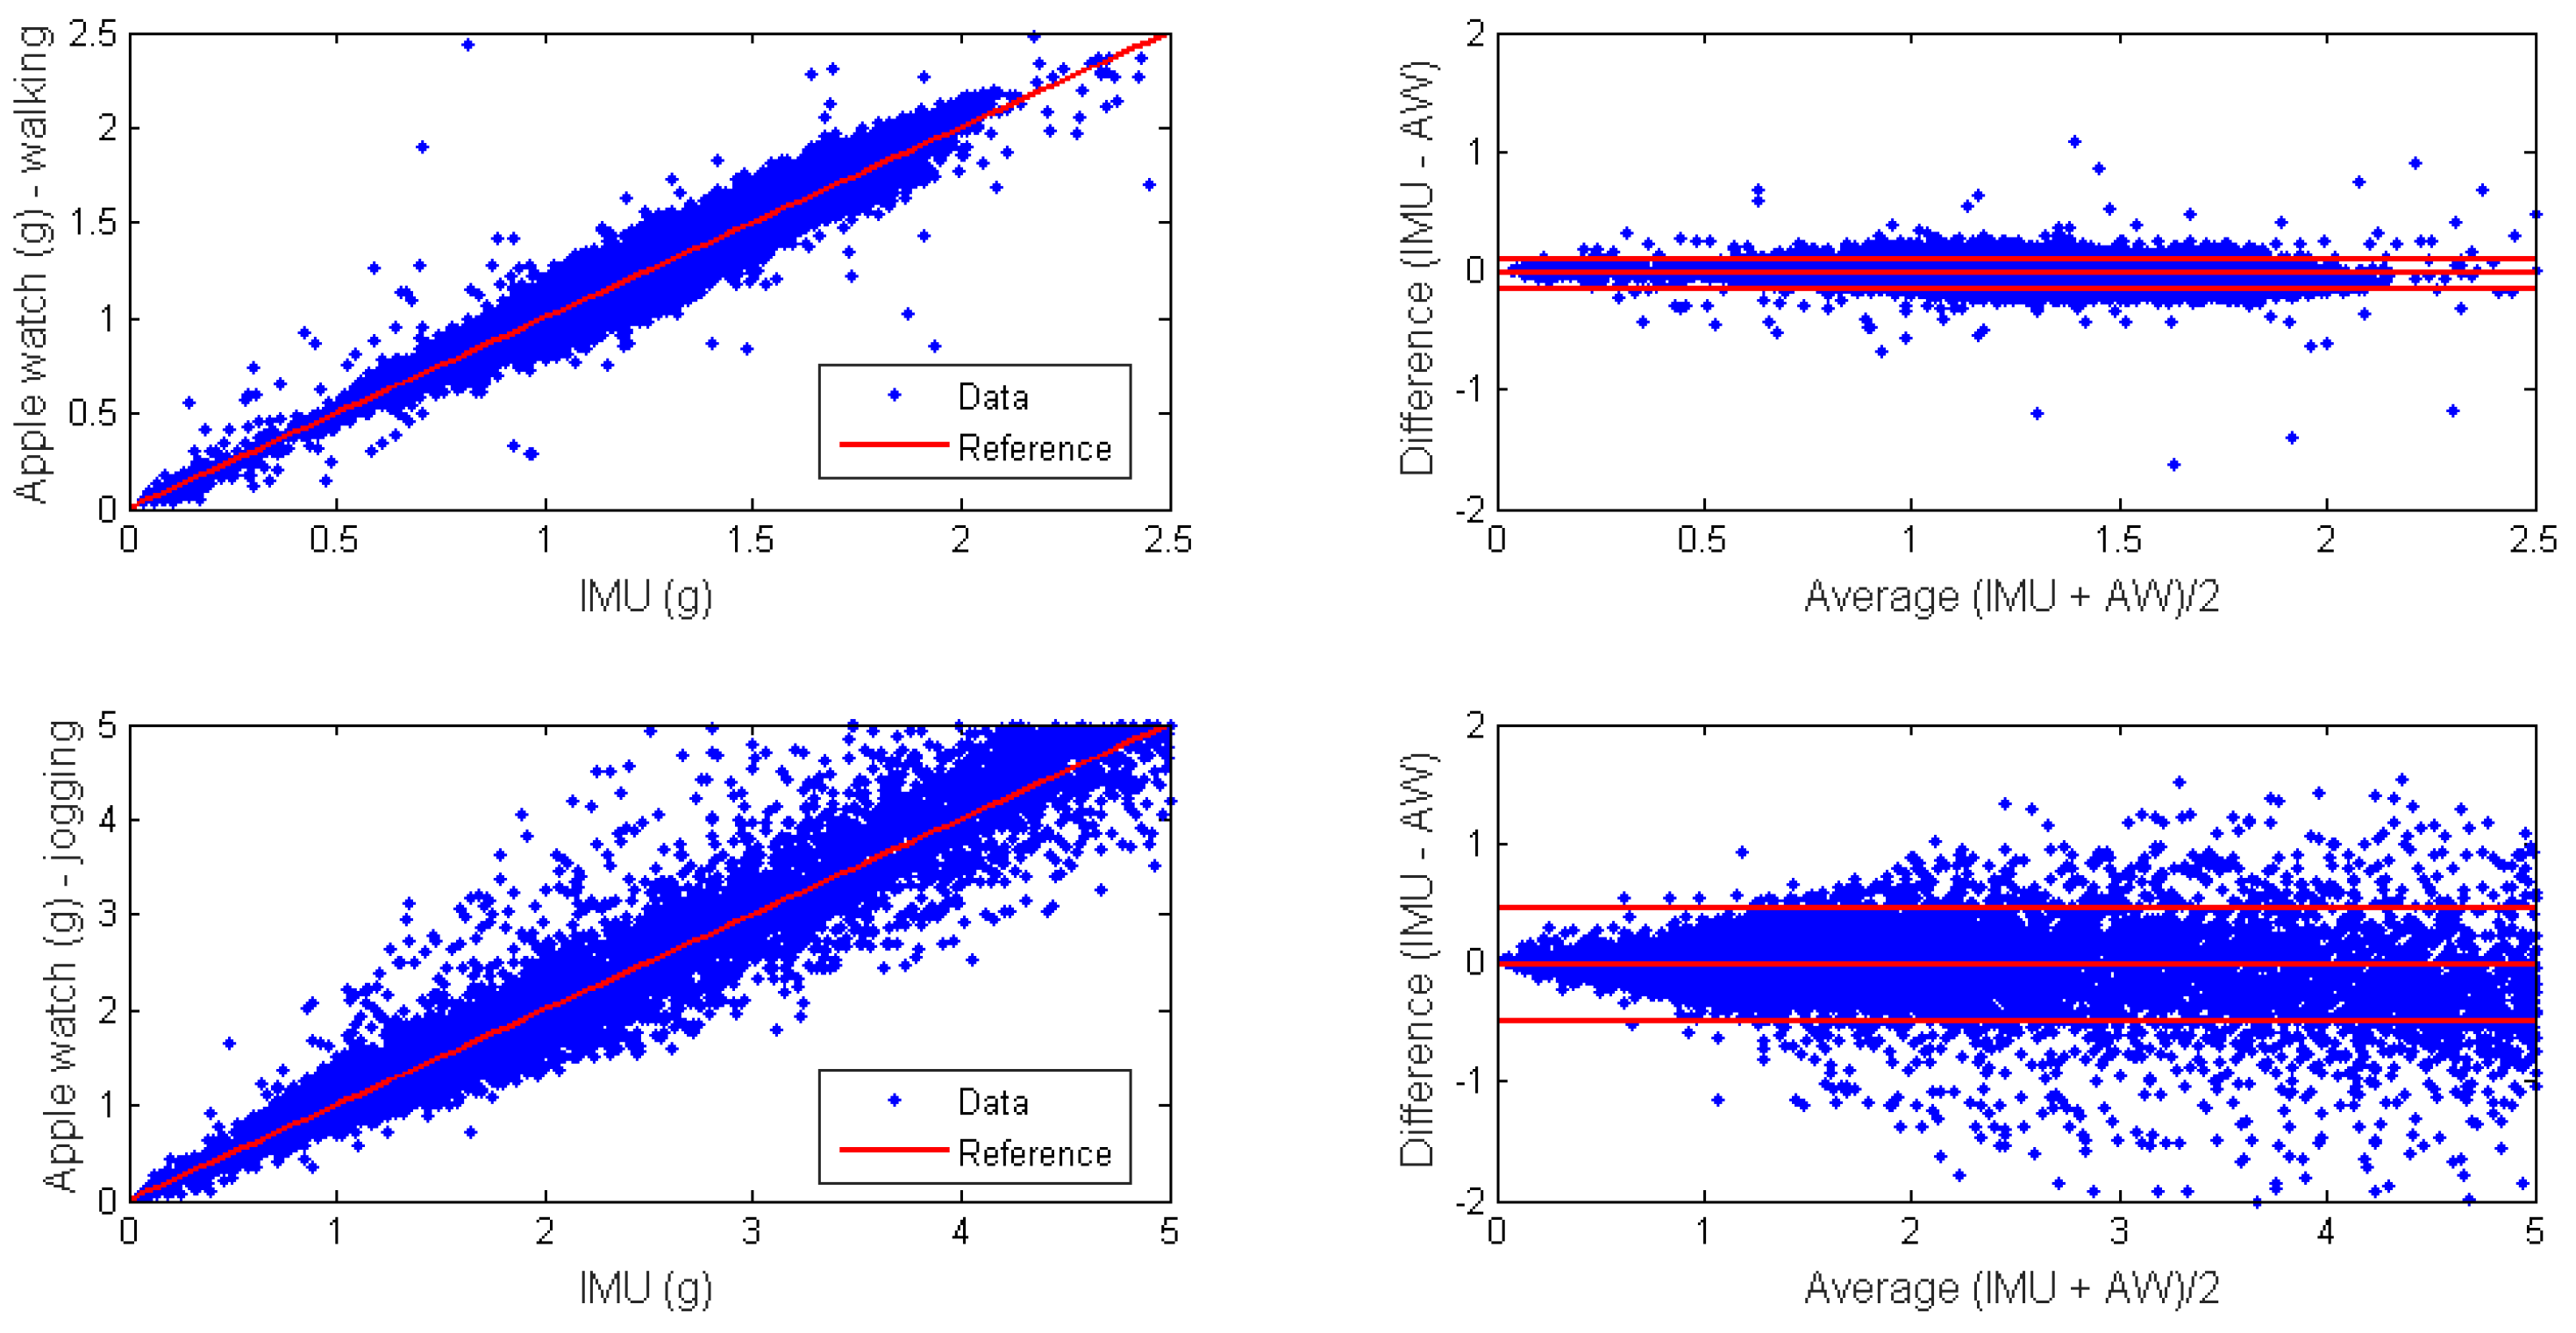
The raw acceleration data for the three axes of the Apple watch was extracted for the 700 m walk and the 300 m jog. A comparison of the raw unfiltered acceleration data between the Apple watch and the IMU was conducted using Pearson correlation and Bland–Altman analysis. Due to the raw data having different sample numbers, the data was adjusted to the same timescale using a one-dimensional linear interpolation [15]. Figure 3 shows the Pearson correlation (left column) and Bland–Altman analysis (right column) for all participants. The first row corresponds to walking and the second row to jogging. Although the vertical axis was slightly dominant in all sets, the root mean square (RMS) was taken as a measure inclusive of all IMU axes.
On the correlation plots (Figure 3), the solid line represents the positive trend and maximum data match. On the Bland–Altman plots, the middle solid line represents the mean (bias) difference and the upper and lower solid lines represent the 95% limits of agreement. The total number of scatter points in all cases and for all participants was greater than 75,000 samples for walking and 25,000 samples for jogging.
The Pearson correlation coefficients for all participant’s acceleration data was r > 0.95, the number of points outside the LoA for walking was 2102 and for jogging is 1262. This gives a percent error for walking of 2.6% and for jogging of 5.1%. These results indicate a strong relationship and agreement between the acceleration data of the watch and the IMU. Although the total number of steps was the same for both devices (Figure 2), the error in the Bland–Altman analysis was due to small differences in the raw data related to the sensor’s sensitivity. In any case, the mean bias was very close to zero and both the upper and lower LoA were narrow (−0.15 and 0.1 g for walking and −0.48 and 0.46 g for jogging). The dispersion and variability in the jogging data, particularly at the tail end, suggests that there was more sensitivity in higher acceleration peaks due to stronger ground impacts of the feet.
3.2. Heart Rate Measurements
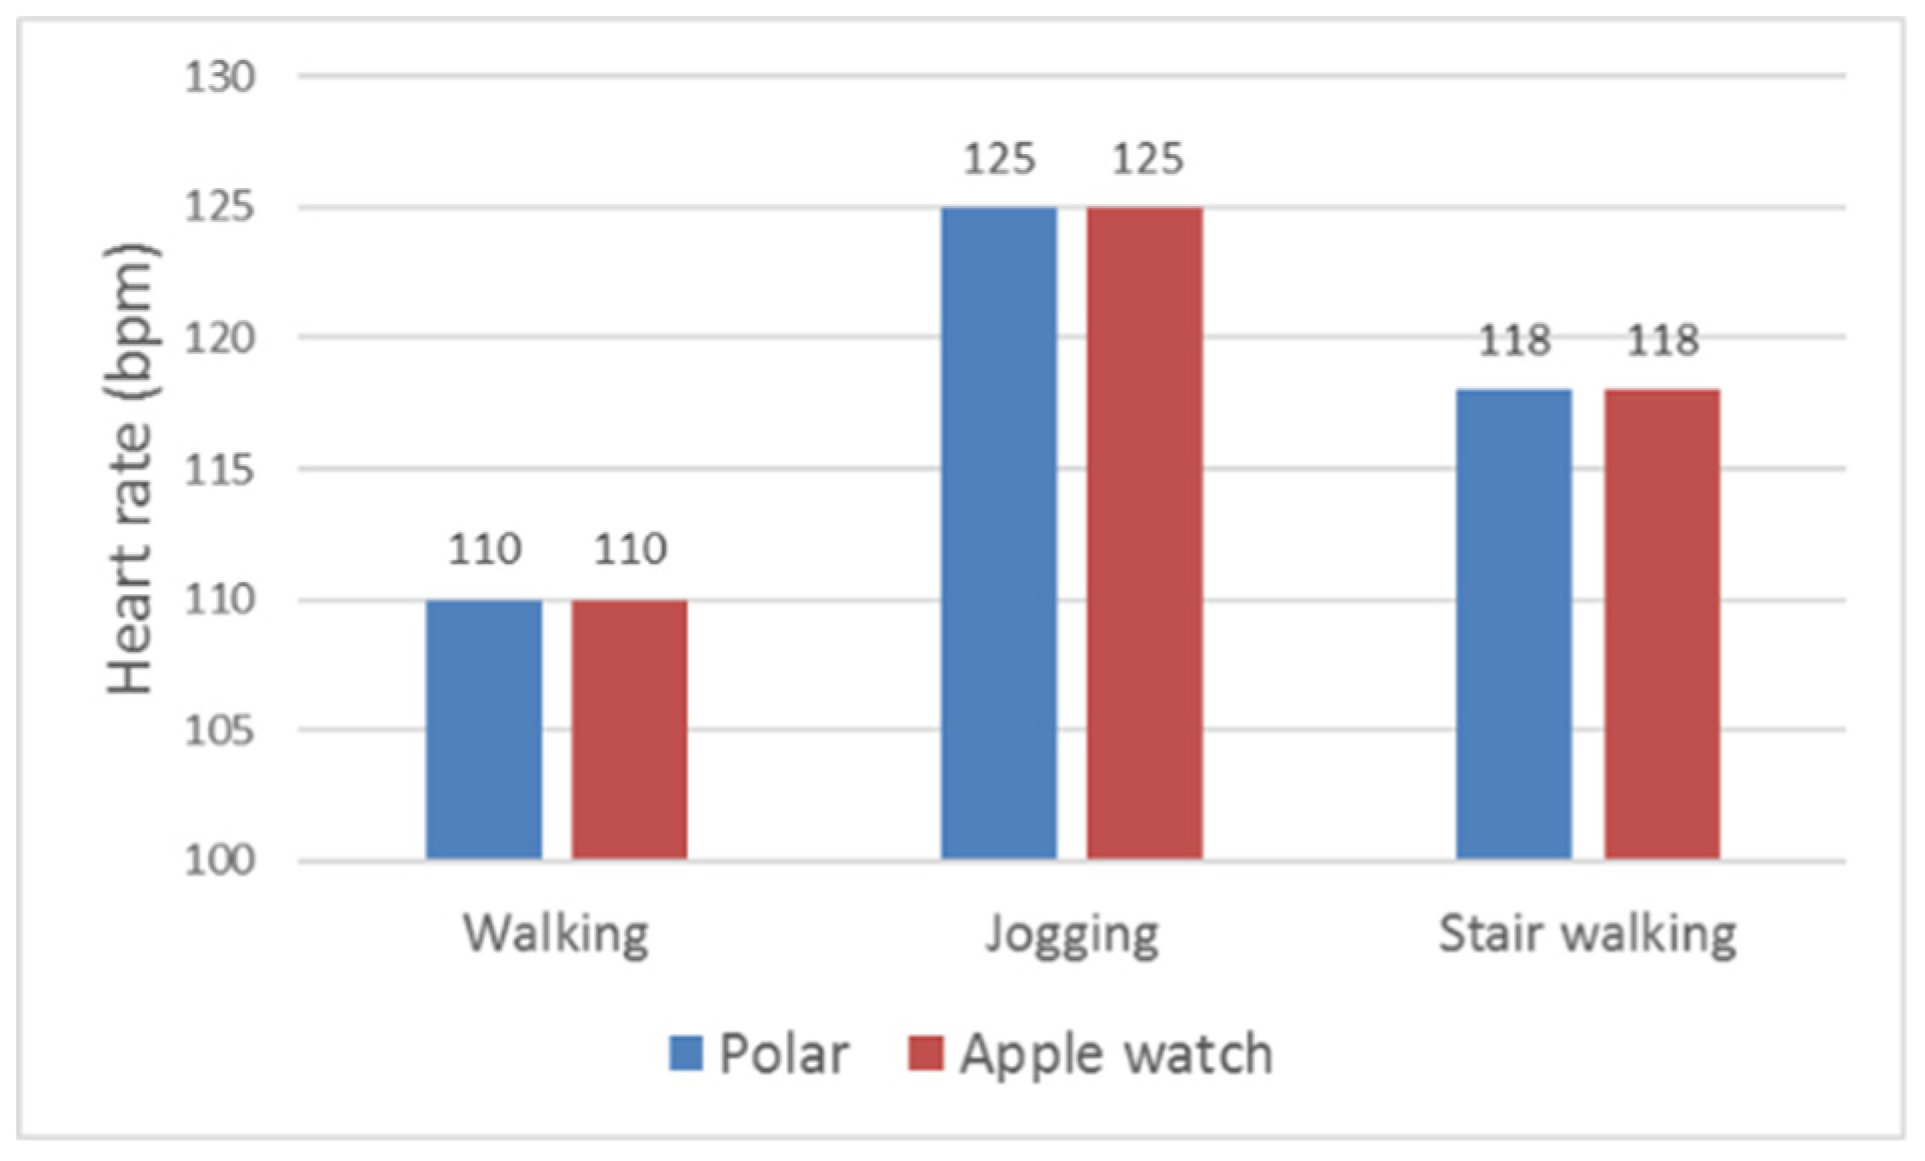
A comparison of the mean beats per minute (bpm) value for the Polar H10 and the Apple watch was made under walking, jogging and stair climbing activities. The Apple watch in workout mode gave approximately 12 heart rate samples per minute, while the Polar H10 gave 60 values per minute. Figure 4 shows strong accuracy in each activity for all participants.
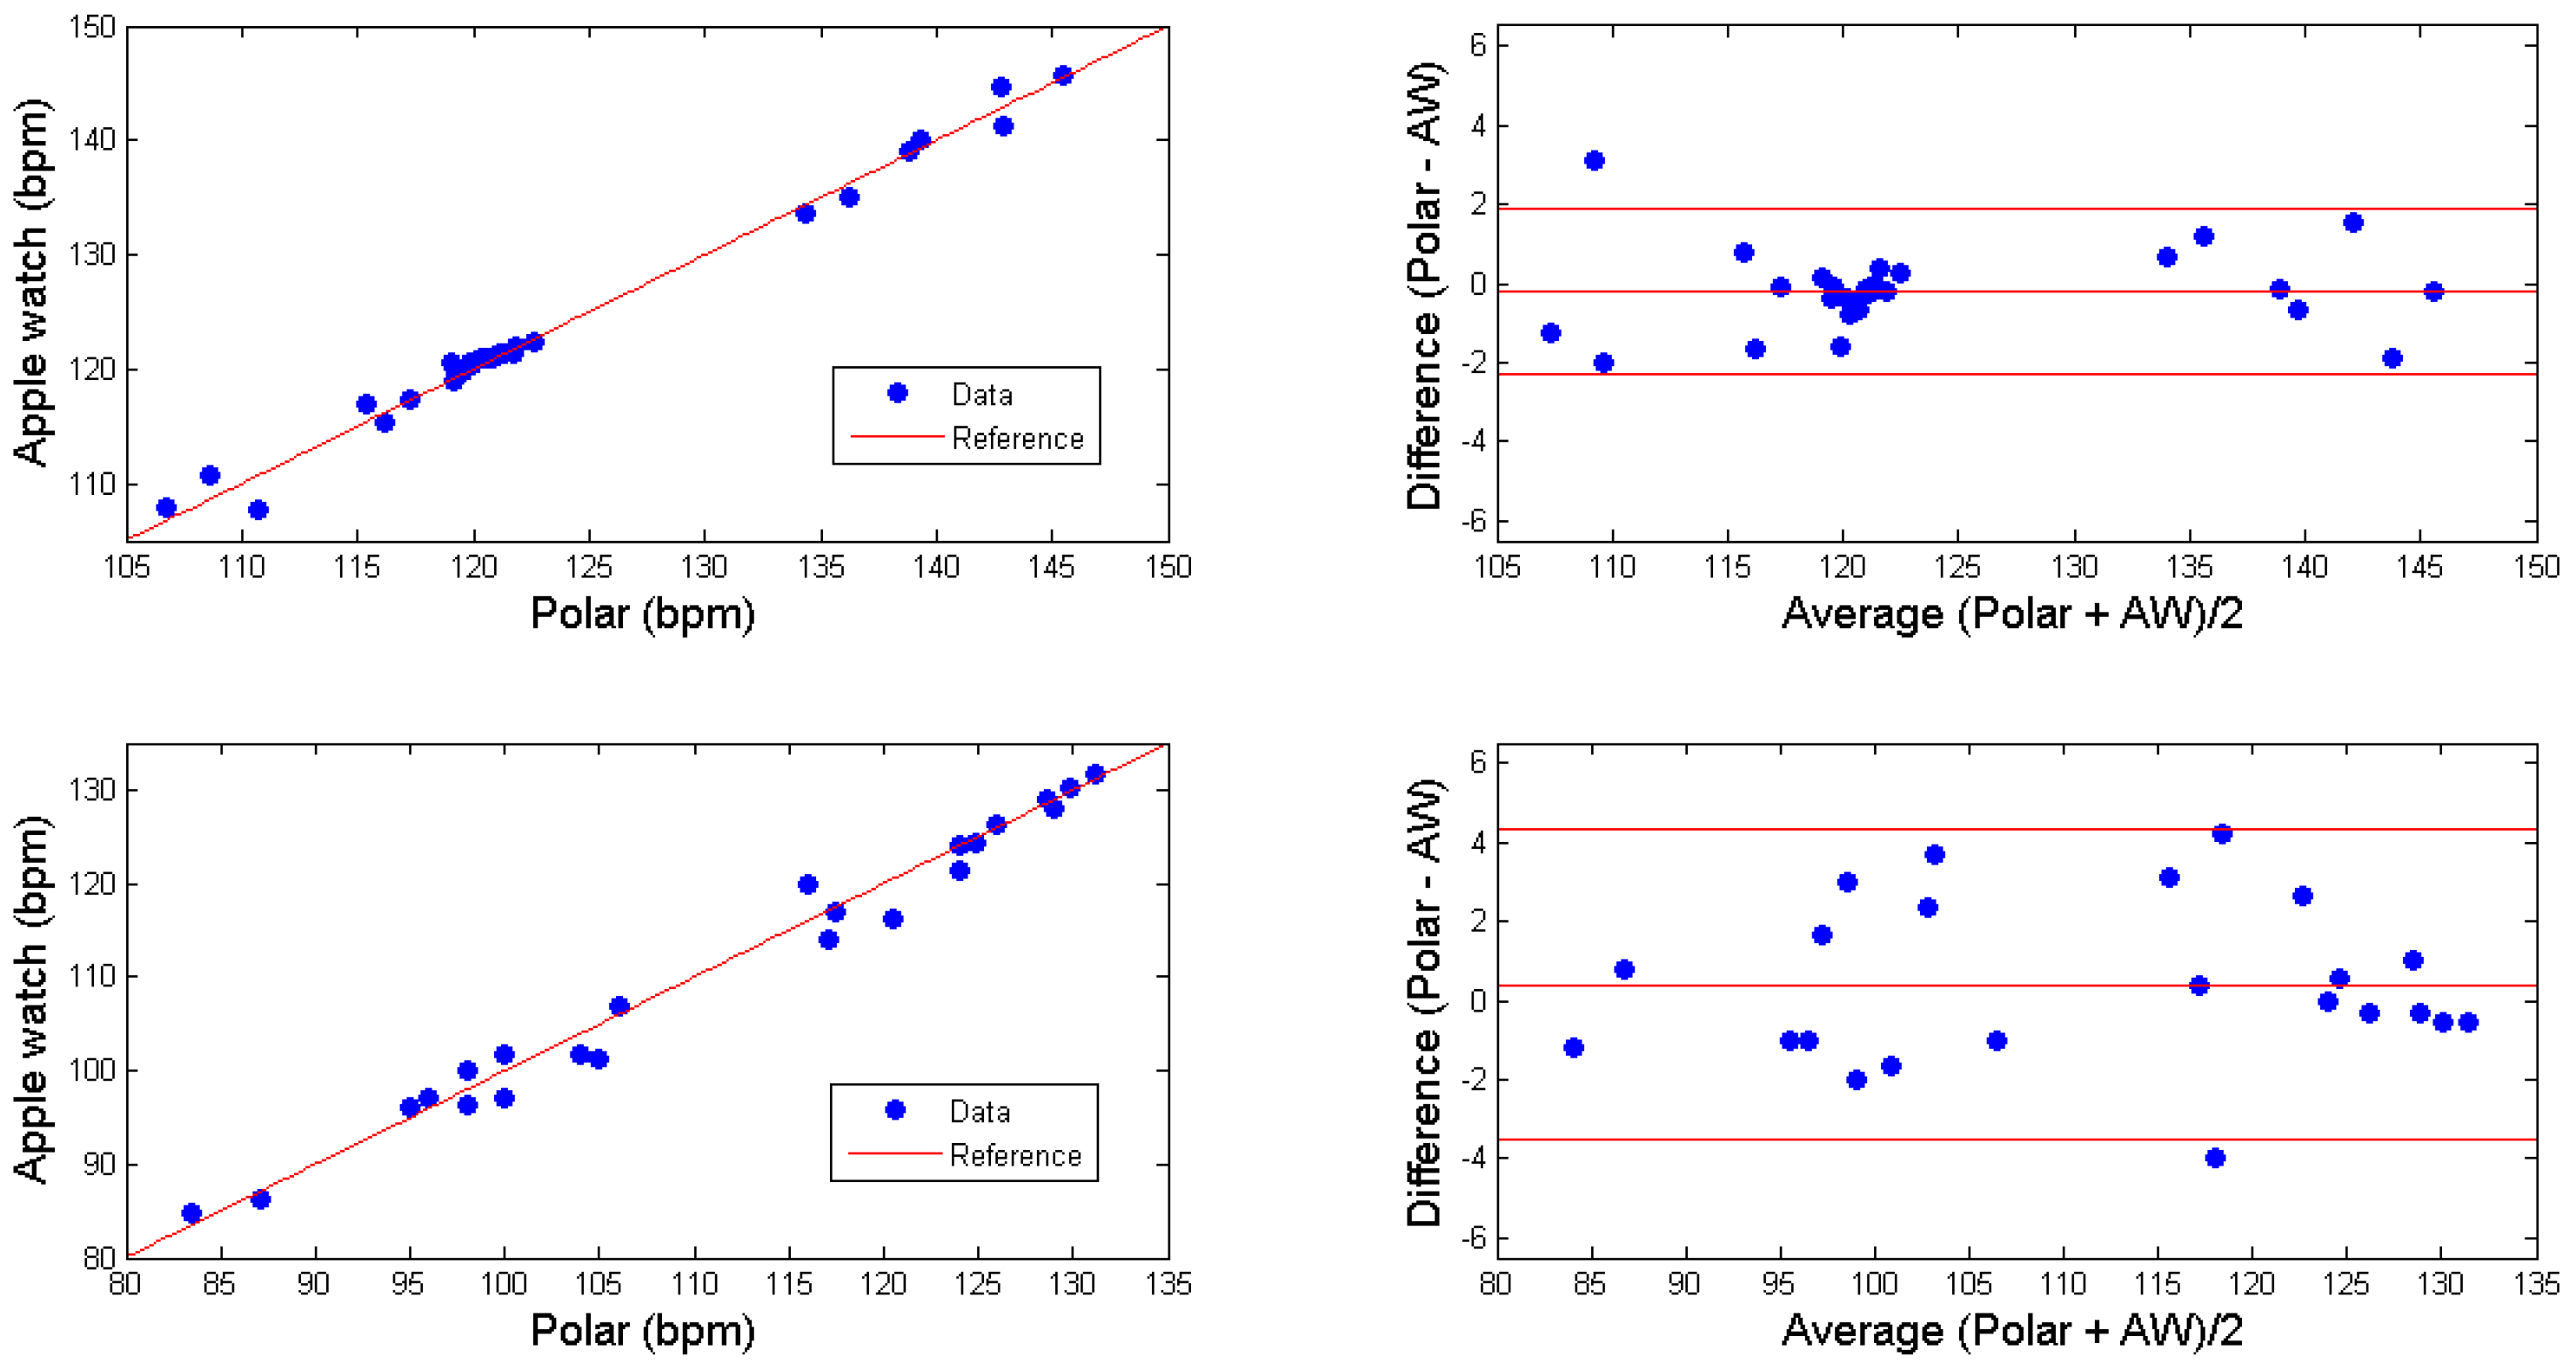
Pearson correlation and Bland–Altman analysis of the heart rate were performed to determine the level of agreement between the Apple watch and the Polar H10. To account for the different number of values recorded per minute, the heart rate data from each device was converted giving a heart rate sample every 15 s. Figure 5 shows the correlation between data sets (left column) and the Bland–Altman analysis (right column). The first row is walking and the second is jogging.
The Pearson correlation coefficient was 0.99 in all three cases. The Bland–Altman analysis showed a mean bias very close to zero and a narrow LoA (−2.2 and 1.8 bpm for walking and −3.5 and 4.3 bpm for jogging). The filtered data showed very good agreement from both devices.
4. Conclusions
Different wearable technologies have been used to compare the performance of an Apple watch (worn on the wrist). Analysis of means, correlations and mean differences using Bland–Altman analyses were conducted in order to validate the functionality, accuracy and reliability of the watch. Inertial sensors and heart rate optical sensors embedded into the watch were tested through a structured protocol of light to moderate physical activities. The experiments assessed total step count, heart rate data, and raw acceleration agreement between data sets. All correlations were greater than 0.95 and all data sets showed high level of agreement using Bland–Altman analysis. The watch counted steps and the measured heart rate were highly accurate. Therefore, we conclude that the acceleration and the heart rate data could be trusted within acceptable limits of accuracy.
Conflicts of Interest
The authors declare no conflict of interest.
References
- Wartburton, D.E.; Nicol, C.W.; Bredin, S.S. Health benefits of physical activity: The evidence. CMAJ 2006, 174, 801–809. [Google Scholar] [CrossRef] [PubMed]
- Tuso, P. Strategies to increase physical activity. Perm J. 2015, 19, 84–88. [Google Scholar] [CrossRef] [PubMed]
- Espinosa, H.G.; Shepherd, J.B.; Thiel, D.V.; Worsey, M.T.O. Anytime, anywhere! Inertial sensors monitor sports performance. IEEE Potentials. 2019, 38, 11–16. [Google Scholar] [CrossRef]
- Canalys, North American Wearable Band Shipments and Annual Growth. Available online: https://www.canalys.com/newsroom/north-america-wearables-q2-2019 (accessed on 11 November 2019).
- Thomson, E.A.; Nuss, K.; Comstock, A.; Reinwald, S.; Blake, S.; Pimentel, R.E.; Tracy, B.L.; Li, K. Heart rate measures from the Apple Watch, Fitbit Charge HR 2, and electrocardiogram across different exercise intensities. J. Sports Sci. 2019, 37, 1411–1419. [Google Scholar] [CrossRef] [PubMed]
- Bai, Y.; Hibbing, P.; Mantis, C.; Welk, G.J. Comparative evaluation of heart rate-based monitors: Apple Watch vs. Fitbit Charge HR. J. Sports Sci. 2018, 36, 1734–1741. [Google Scholar] [CrossRef] [PubMed]
- Gillinov, S.; Etiwy, M.; Wang, R.; Blackburn, G.; Phelan, D.; Gillinov, A.M.; Houghtaling, P.; Javadikasgari, H.; Desai, M.Y. Variable accuracy of wearable heart rate monitors during aerobic exercise. Med. Sci. Sports Exerc. 2017, 49, 1697–1703. [Google Scholar] [CrossRef] [PubMed]
- Tam, K.M.; Cheung, S.Y. Validation of electronic activity monitor devices during treadmill walking. Telemed. e-Health 2018, 24, 782–789. [Google Scholar] [CrossRef] [PubMed]
- Degroote, L.; De Bourdeaudhuij, I.; Verloigne, M.; Poppe, L.; Crombez, G. The accuracy of smart devices for measuring physical activity in daily life: Validation study. JMIR mHealth uHealth 2018, 6, e10972. [Google Scholar] [CrossRef] [PubMed]
- Imboden, M.T.; Nelson, M.B.; Kaminsky, L.A.; Montoye, A.H. Comparison of four Fitbit and Jawbone activity monitors with a research-grade ActiGraph accelerometer for estimating physical activity and energy expenditure. Br. J. Sports Med. 2018, 52, 844–850. [Google Scholar] [CrossRef] [PubMed]
- Espinosa, H.G.; Lee, J.; James, D.A. The inertial sensor: A base platform for wider adoption in sports science applications. J. Fitness Res. 2015, 4, 1–8. [Google Scholar]
- Thiel, D.V.; Shepherd, J.; Espinosa, H.G.; Kenny, M.; Fischer, K.; Worsey, M.; Matsuo, A.; Wada, T. Predicting ground reaction forces in sprint running using a shank mounted inertial measurement unit. Proceedings 2018, 2, 199. [Google Scholar]
- Fitzpatrick, T.B. The validity and practicality of sun-reactive skin types I through VI. Arch. Dermatol. 1988, 124, 869–871. [Google Scholar] [CrossRef] [PubMed]
- Bland, J.M.; Altman, D.G. Statistical methods for assessing agreement between two methods of clinical measurement. Lancet 1986, 327, 307–310. [Google Scholar] [CrossRef]
- Espinosa, H.G.; Nordsborg, N.; Thiel, D.V. Front crawl swimming analysis using accelerometers: A preliminary comparison between pool and flume. Procedia Eng. 2015, 112, 497–501. [Google Scholar] [CrossRef]
Figure 1.
Example of 10 steps of raw unfiltered acceleration data for the Apple watch and the inertial monitoring units (IMU). Walking (left) and jogging (right).
Figure 1.
Example of 10 steps of raw unfiltered acceleration data for the Apple watch and the inertial monitoring units (IMU). Walking (left) and jogging (right).

Figure 2.
Mean step count measurements for all participants using the Apple watch and the IMU in walking and jogging. The data was validated by an observer count.
Figure 2.
Mean step count measurements for all participants using the Apple watch and the IMU in walking and jogging. The data was validated by an observer count.

Figure 3.
Correlation (left column) and Bland–Altman analysis (right column) for the Apple watch (AW) and IMU acceleration data on walking (top row) and jogging (bottom row).
Figure 3.
Correlation (left column) and Bland–Altman analysis (right column) for the Apple watch (AW) and IMU acceleration data on walking (top row) and jogging (bottom row).

Figure 4.
Mean heart rate value for the Apple watch and Polar H10 on three different activities: walking, jogging and stair climbing.
Figure 4.
Mean heart rate value for the Apple watch and Polar H10 on three different activities: walking, jogging and stair climbing.

Figure 5.
Correlation (left column) and Bland–Altman analysis (right column) for the Apple watch (AW) and IMU heart rate data on walking (top row) and jogging (bottom row).
Figure 5.
Correlation (left column) and Bland–Altman analysis (right column) for the Apple watch (AW) and IMU heart rate data on walking (top row) and jogging (bottom row).

Publisher’s Note: MDPI stays neutral with regard to jurisdictional claims in published maps and institutional affiliations. |
© 2020 by the authors. Licensee MDPI, Basel, Switzerland. This article is an open access article distributed under the terms and conditions of the Creative Commons Attribution (CC BY) license (https://creativecommons.org/licenses/by/4.0/).
Share and Cite
MDPI and ACS Style
Espinosa, H.G.; Thiel, D.V.; Sorell, M.; Rowlands, D. Can We Trust Inertial and Heart Rate Sensor Data from an APPLE Watch Device? Proceedings 2020, 49, 128. https://doi.org/10.3390/proceedings2020049128
AMA Style
Espinosa HG, Thiel DV, Sorell M, Rowlands D. Can We Trust Inertial and Heart Rate Sensor Data from an APPLE Watch Device? Proceedings. 2020; 49(1):128. https://doi.org/10.3390/proceedings2020049128
Chicago/Turabian StyleEspinosa, Hugo G., David V. Thiel, Matthew Sorell, and David Rowlands. 2020. "Can We Trust Inertial and Heart Rate Sensor Data from an APPLE Watch Device?" Proceedings 49, no. 1: 128. https://doi.org/10.3390/proceedings2020049128